Candlestick patterns are one of the most powerful tools in a trader’s arsenal. They provide visual insights into market sentiment and help predict potential price movements. But to use them effectively, you need more than just recognition—you need understanding.
At International Trading Institute, we teach our students how to confidently read and interpret candlestick charts to make smart, data-driven decisions in the market. Here’s your introduction to reading candlestick patterns like a professional.
What Is a Candlestick Chart?
A candlestick chart is a type of price chart that displays the open, high, low, and close of a security for a specific time period. Each “candle” represents this information in a single bar:
- Body: Shows the range between the open and close prices.
- Wicks (or shadows): Indicate the highest and lowest prices during the time frame.
- Color: A green (or white) candle shows a price increase, while a red (or black) candle shows a price decrease.
Why Candlestick Patterns Matter
Candlestick patterns reflect market psychology and reveal the battle between buyers and sellers. By analyzing patterns, traders can identify potential reversals, continuations, and periods of indecision.
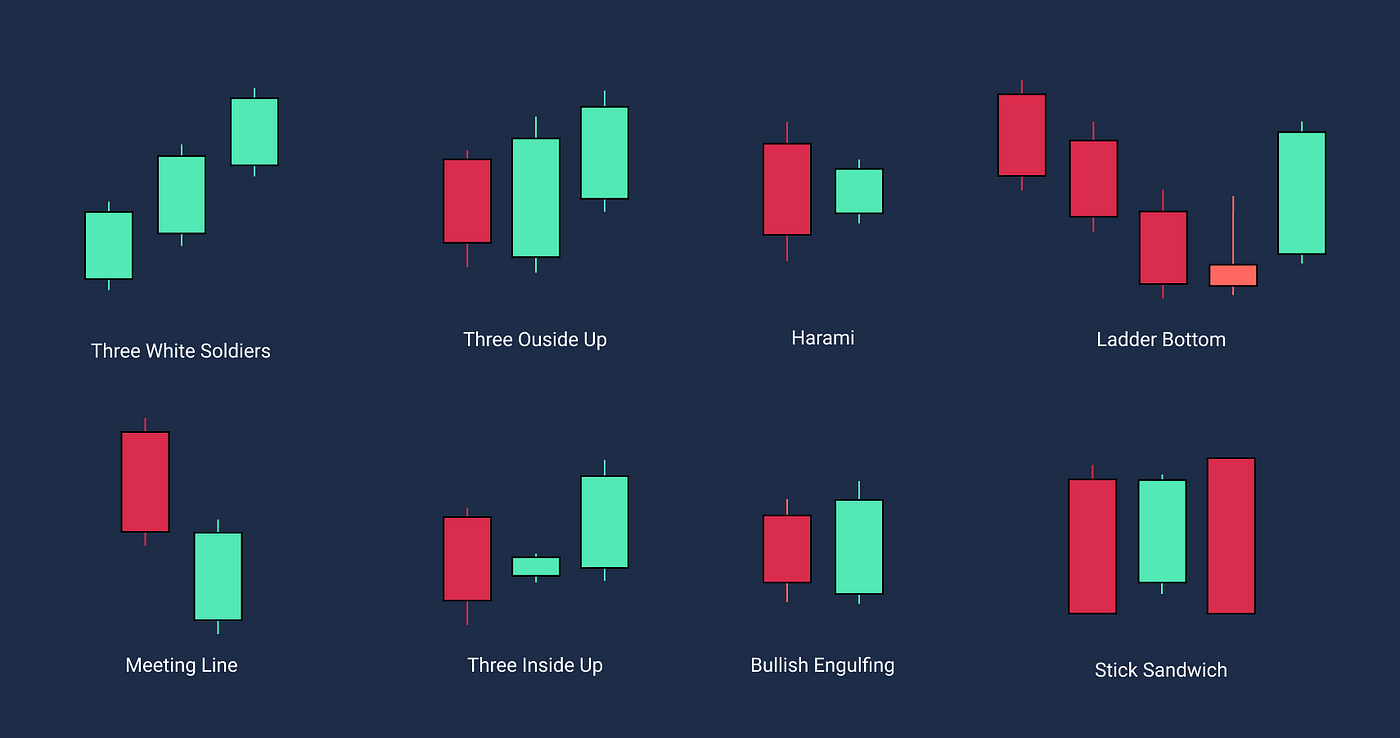
Common Candlestick Patterns to Know
1. Doji
- What it shows: Indecision in the market.
- How to use it: Often appears before a reversal when confirmed with volume or support/resistance zones.
2. Hammer and Inverted Hammer
- What it shows: A possible reversal after a downtrend.
- How to use it: Look for confirmation with the next bullish candle.
3. Engulfing Patterns (Bullish/Bearish)
- What it shows: A strong shift in momentum.
- How to use it: Bullish engulfing after a downtrend may signal a buying opportunity.
4. Shooting Star
- What it shows: Bearish reversal after an uptrend.
- How to use it: Watch for price rejection from a resistance level.
5. Morning Star / Evening Star
- What it shows: Reversal patterns with strong reliability.
- How to use it: These appear at the end of trends and suggest a strong reversal when supported by volume.
How to Use Candlesticks in Trading
- Combine with Other Indicators
Candlesticks are more effective when used with moving averages, RSI, or support/resistance levels. - Focus on Context
A pattern is only meaningful when considered in the context of the trend and the broader market. - Wait for Confirmation
Don’t act on a pattern alone—wait for the next candle or volume confirmation before entering a trade.
Learn Candlestick Mastery at ITI
At International Trading Institute, we don’t just show you what the patterns are—we teach you how to read them in real-time, combine them with strategies, and apply them confidently in live markets. Whether you’re just starting or want to refine your skills, our courses cover:
- Real-world candlestick setups
- Live chart analysis sessions
- Mentorship to develop chart reading confidence
Final Thoughts
Reading candlestick patterns like a pro doesn’t come from memorizing shapes—it comes from understanding what those patterns represent and how they fit into the bigger picture.
Join ITI’s expert-led courses and take the guesswork out of chart reading—build real confidence in your technical analysis skills.